Carrie Bennette
Data Scientist & Data Visualization Designer
Data Scientist & Data Visualization Designer
Hi, I'm Carrie. Nice to meet you.
I'm a biostatistician and health economist by training and a data visualization designer at heart. I use statistical and mathematical models to conduct research that informs domestic and global health policy. Over the past 12+ years, I've worked with academics, non-profit organizations, tech startups and large corporations to discover and communicate data-driven insights in a visually engaging and effective way.
I leverage my PhD-level training in biostatistics and econometrics plus industry experience working as data scientist to ensure all analyses are statistically sound and scientifically rigorous.
Expertise:
I create both static and interactive visualizations for use in print and online. I love to make standard charts look beautiful as well as design completely custom visualizations to tell a unique story.
Tools I use:
Data Visualization Portfolio
Here are a few data visualizations I've created recently:
Publications
A complete list of my peer-reviewed publications (more than 100) is available on Google Scholar. My research interests are broad and span biostatstics, outcomes research, data sharing, decision analytic modeling, machine learning and policy evaluation. Below are links to some of my favorite papers:
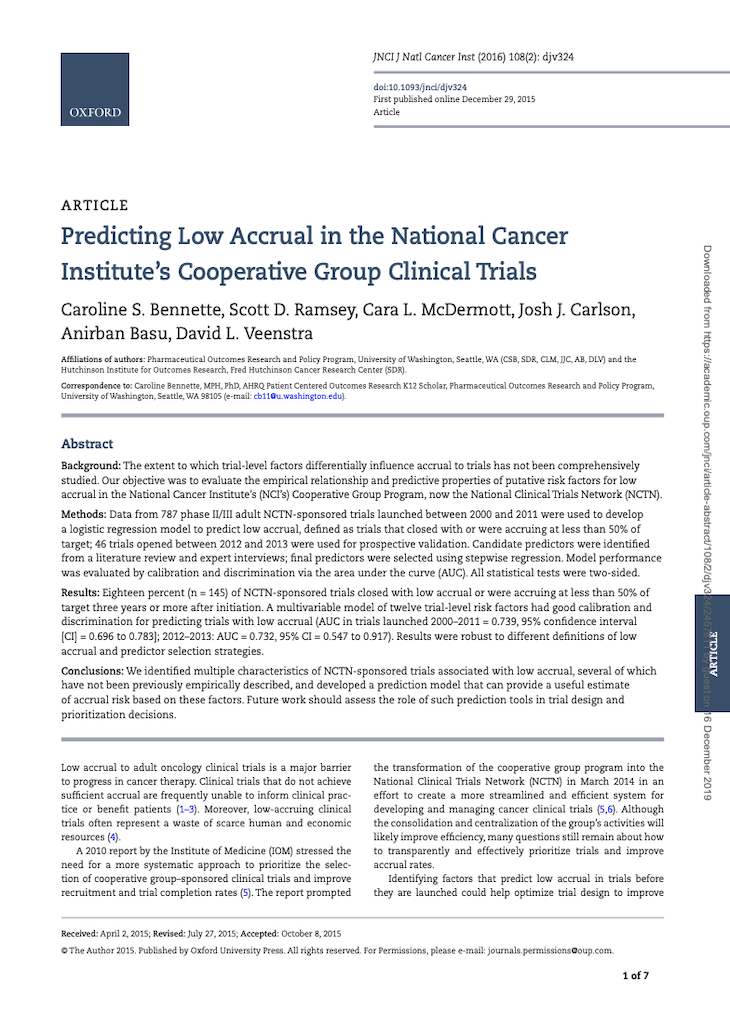
Which trials will enroll enough cancer patients?
(Hint: not all of them)
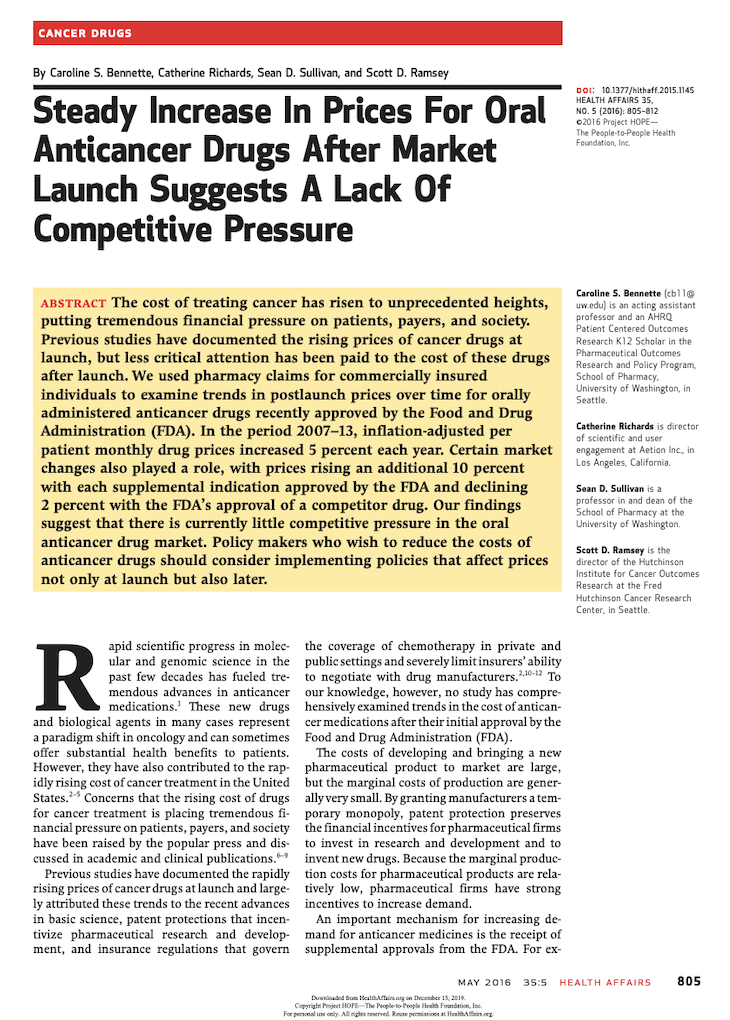
The prices of cancer drugs mostly go up 📈 and in economically predictable ways
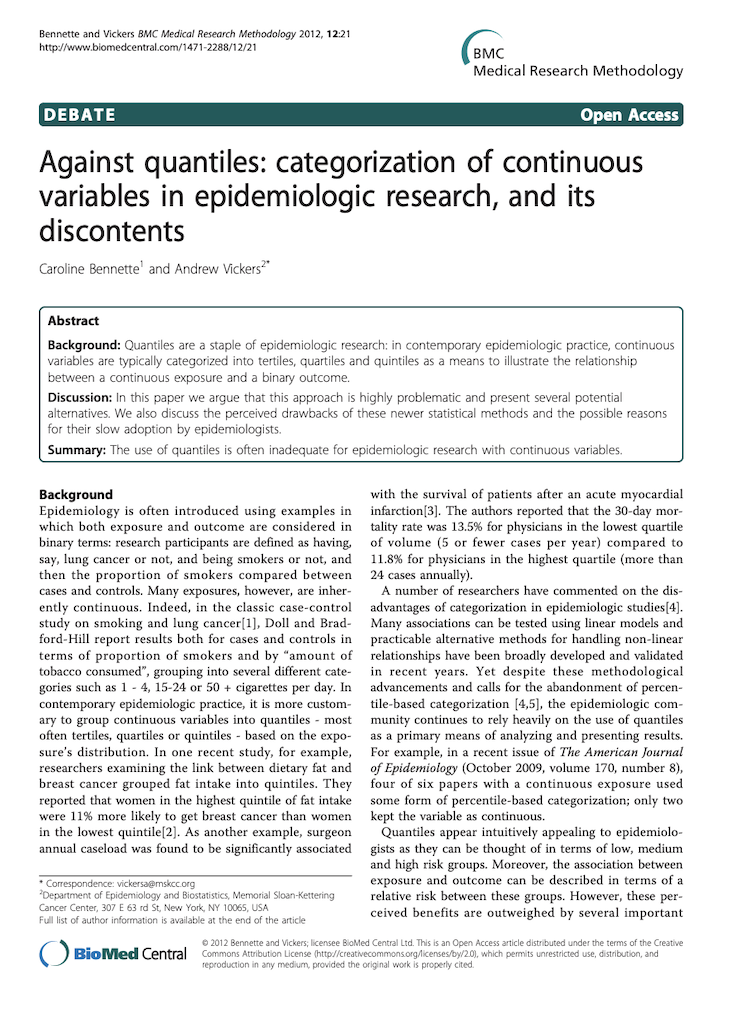
Please don't categorize your continuous variables
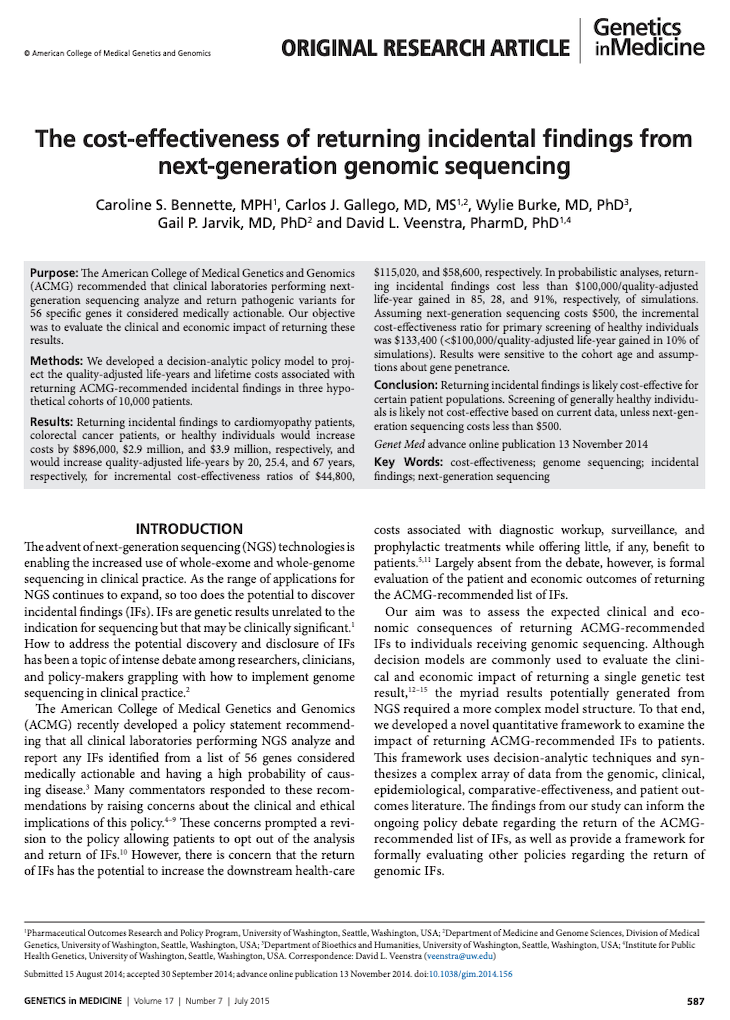
Is it cost-effective
to return secondary findings from genomic sequencing?
(Mostly yes)
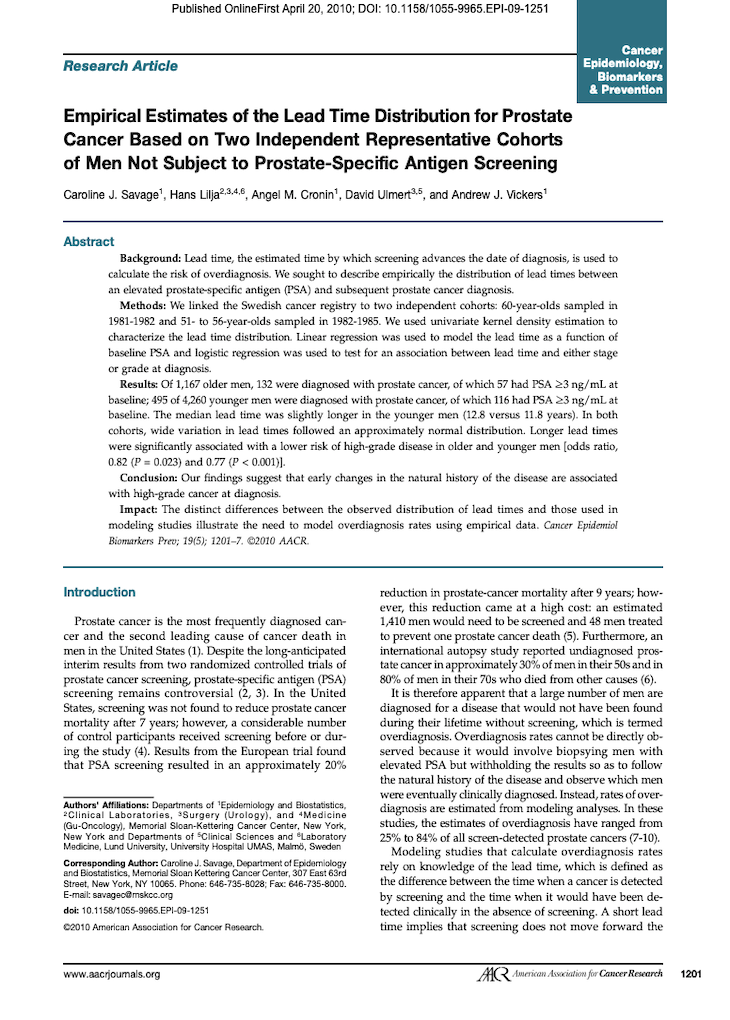
How much earlier does PSA screening find prostate cancer?
(Roughly a decade)
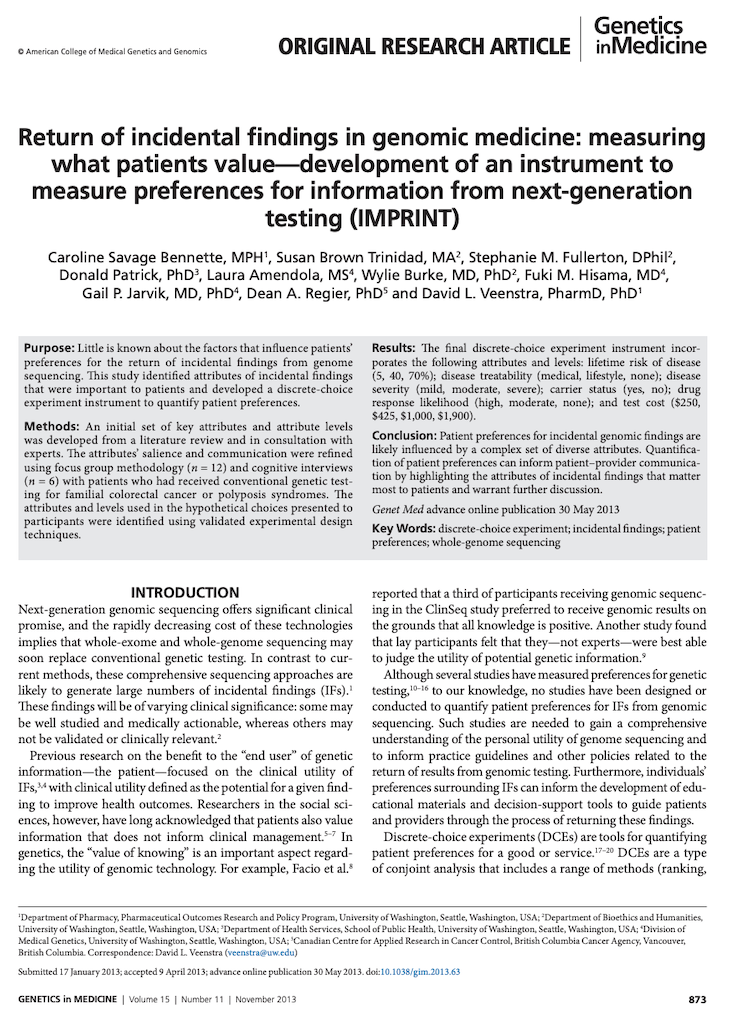
Can we quantify patient preferences for genomic findings?
(Yep & here's how)
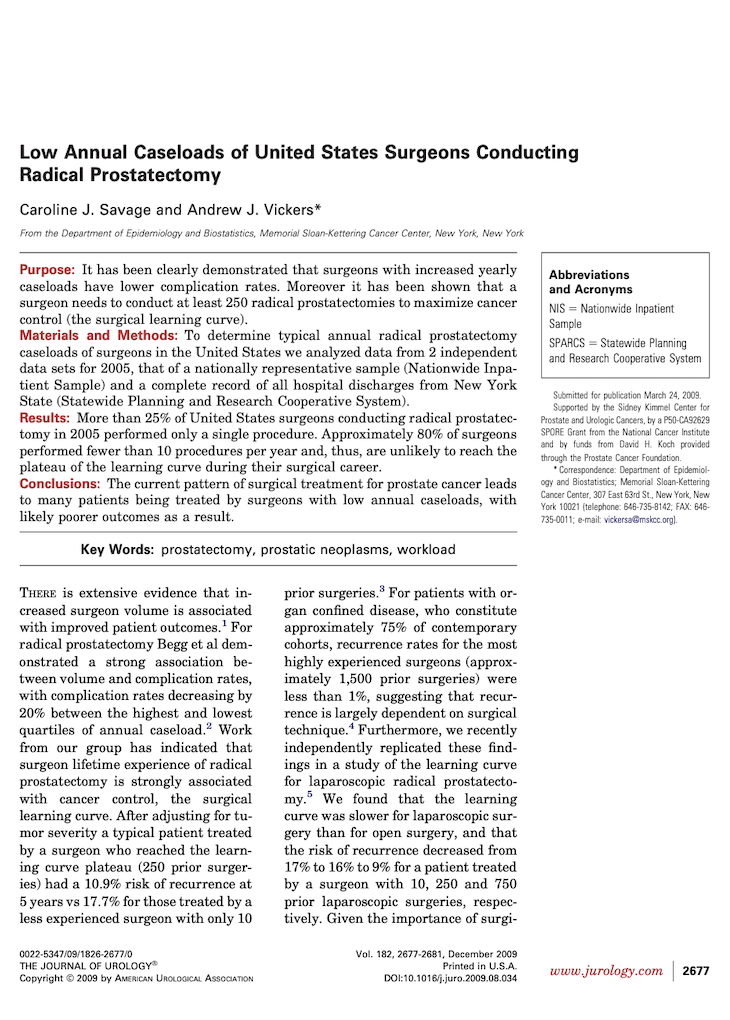
Most surgeons removing prostates have low annual caseloads
(& why that's scary)
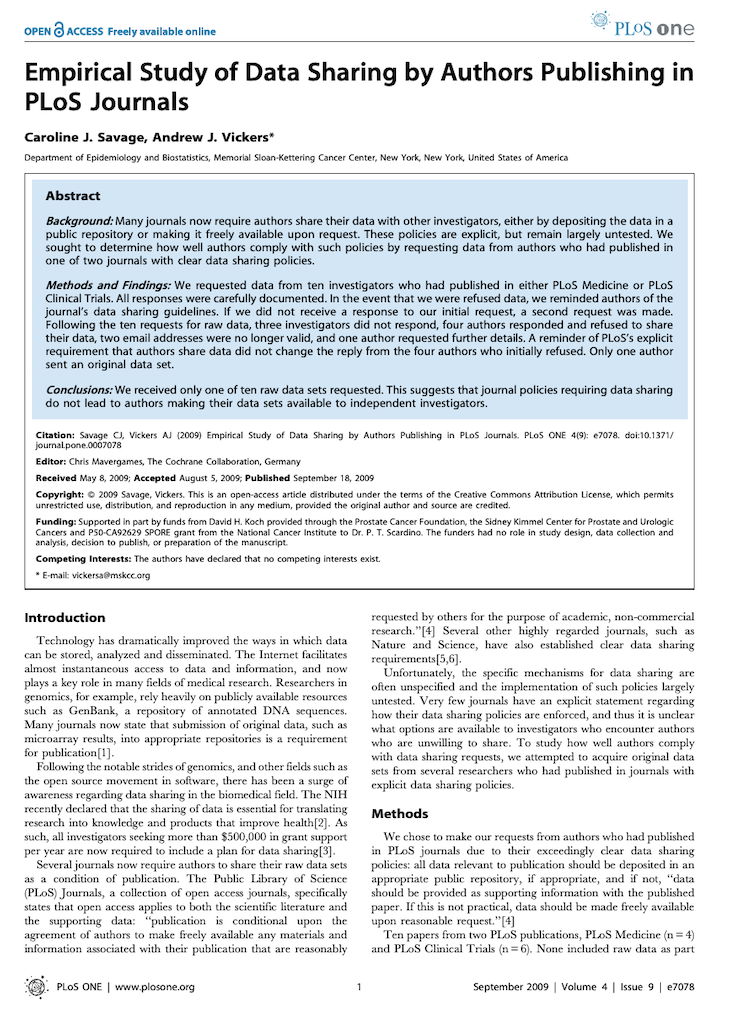
Will you please
share your data with me?
(Mostly no 😔)
Which clinical trials will generate the most valuable evidence?
(Here's a new method to help answer)
Diminishing
marginal health benefits from new drugs for cancer 💊
(This one's my favorite)